Overview
Macroeconomics refers to the study of the overall performance of the economy. Macroeconomics
deals with the overall aggregate effect of microeconomics. Macroeconomics is crucial
for the government to understand and predict the long-term consequences of their
decisions.
Summary
- Macroeconomics refers to the study of the aggregate economy.
- The primary goals of macroeconomics are to achieve stable economic growth and maximize
the standard of living.
- Economic indicators are a good source of information to track macroeconomic performance.
- Monetary policy and fiscal policy are tools used by the government to control economic
performance and reach macroeconomic goals.
Goals of Macroeconomics
The overarching goals of macroeconomics are to maximize the standard of living and
achieve stable economic growth. The goals are supported by objectives such as minimizing
unemployment, increasing productivity, controlling inflation, and more. The macroeconomy
of a country is affected by many forces, and as such, economic indicators are invaluable
to assessing different aspects of performance.
Macroeconomic Factor
A macroeconomic factor is a pattern, characteristic, or condition that emanates
from, or relates to, a larger aspect of an economy rather than to a particular population.
The characteristic may be a significant economic, environmental, or geopolitical
event that widely influences a regional or national economy.
A macroeconomic factor can include something that affects the course or direction
of a given large-scale economy. Monetary policies and other regulations, for example,
can affect national and state economies, while also coming with potentially great
global consequences.
Inflation, gross domestic product (GDP), national income, and unemployment levels
are examples of macroeconomic factors. Such economic performance metrics are closely
tracked by states, companies, and consumers alike. The correlation between various
macroeconomic factors is extensively researched in the field of macroeconomics.
Inflation
Inflation is a progressive increase in the average cost of goods and services in
the economy over time.
Economic Growth Rate
The economic growth rate is the percent change in the cost of the output of goods
and services in a country across a specific period of time, relative to a previous
period.
Price Level
A price level is the variation of existing prices for economically produced goods
and services. In broader terms, the level of prices refers to the costs of a good,
service, or security.
Gross Domestic Product (GDP)
The gross domestic product (GDP) is a quantitative measure of the market value of
all finished goods and services produced over a given time period.
National Income
National income is the aggregate amount of money generated within a nation.
Unemployment Level
The level or rate of unemployment is the unemployed share of the labor force in
a given country, calculated and stated as a percentage.
Types of Macroeconomic Factors
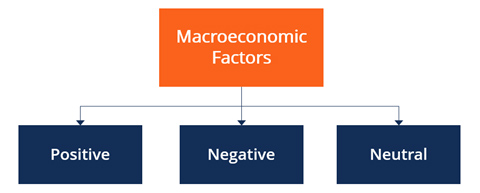
1Positive
Positive macroeconomic factors are comprised of events that ultimately stimulate
economic stability and expansion within a country or a group of countries.
Any development leading to a rise in demand for goods or services (e.g., a decrease
in price) is considered a positive macroeconomic factor. As the demand for products
and services grows, domestic and foreign suppliers of the products will inevitably
benefit from increased revenues resulting from increased customer traffic. Higher
profits will, in effect, grow stock prices on a larger scale.
2Negative
Negative macroeconomic factors include events that may threaten the national or
global economy.
Concerns of political uncertainty induced by the involvement of a nation in civil
or global conflict are likely to worsen economic unrest due to the redistribution
of resources or damage to property, assets, and livelihoods. Negative macroeconomic
factors also include global pandemics (e.g., Covid-19) or natural disasters, such
as hurricanes, earthquakes, flooding, wildfires, etc.
3Neutral
Some economic changes are neither positive nor negative. Instead, the exact consequences
are assessed based on the purpose of the action, such as the control of trade across
regional or national borders.
The nature of a particular action, such as the implementation or discontinuance
of a trade embargo, would come with a variety of consequences that are dependent
on the country being impacted and the objectives behind the action taken.
Importance of Macroeconomic Factors
Economic experts and researchers frequently refer to macroeconomic factor trends
as they try to find ways to clarify economic policy objectives and strive to achieve
economic prosperity. They also attempt to forecast future rates of employment, inflation,
and other main macroeconomic factors. Such forecasts affect the decisions taken
by states, individuals, and businesses.
Gross Domestic Product
It's not just size, growth also matters
What is the GDP Formula?
There are two primary methods or formulas by which GDP can be determined:
1Expenditure Approach
The expenditure approach is the most commonly used GDP formula, which is based on
the money spent by various groups that participate in the economy.
GDP = C + G + I + NX
C = consumption or all private consumer spending within a country’s economy,
including, durable goods (items with a lifespan greater than three years), non-durable
goods (food & clothing), and services.
G = total government expenditures, including salaries of government employees,
road construction/repair, public schools, and military expenditure.
I = sum of a country’s investments spent on capital equipment, inventories,
and housing.
NX = net exports or a country’s total exports less total imports.
2Income Approach
This GDP formula takes the total income generated by the goods and services produced.
GDP = Total National Income + Sales Taxes + Depreciation + Net Foreign Factor Income
Total National Income – the sum of all wages, rent, interest, and profits.
Sales Taxes – consumer taxes imposed by the government on the sales of goods
and services.
Depreciation – cost allocated to a tangible asset over its useful life.
Net Foreign Factor Income – the difference between the total income that
a country’s citizens and companies generate in foreign countries, versus the total
income foreign citizens and companies generate in the domestic country.
What are the Types of GDP?
GPD can be measured in several different ways. The most common methods include:
- Nominal GDP – the total value of all goods and services produced at current
market prices. This includes all the changes in market prices during the current
year due to inflation or deflation.
- Real GDP – the sum of all goods and services produced at constant prices.
The prices used in determining the Gross Domestic Product are based on a certain
base year or the previous year. This provides a more accurate account of economic
growth, as it is already an inflation-adjusted measurement, meaning the effects
of inflation are taken out.
- Actual GDP – real-time measurement of all outputs at any interval or any
given time. It demonstrates the existing state of business of the economy.
- Potential GDP – ideal economic condition with 100% employment across all
sectors, steady currency, and stable product prices.
Why is GDP Important to Economists and Investors?
Gross Domestic Product represents the economic production and growth of a nation
and is one of the primary indicators used to determine the overall well-being of
a country’s economy and standard of living. One way to determine how well a country’s
economy is flourishing is by its GDP growth rate. This rate reflects the increase
or decrease in the percentage of economic output in monthly, quarterly, or yearly
periods.
Gross Domestic Product enables economic policymakers to assess whether the economy
is weakening or progressing, if it needs improvements or restrictions, and if threats
of recession or inflation are imminent. From these assessments, government agencies
can determine if expansionary, monetary policies are needed to address economic
issues.
Investors place importance on GDP growth rates to decide how the economy is changing
so that they can make adjustments to their asset allocation. However, when there
is an economic slump, businesses experience low profits, which means lower stock
prices and consumers tend to cut spending. Investors are also on the lookout for
potential investments, locally and abroad, basing their judgment on countries’ growth
rate comparisons.
What are Some Drawbacks of GDP?
Gross Domestic Product does not reflect the black market, which may be a large part
of the economy in certain countries. The black market, or the underground economy,
includes illegal economic activities, such as the sale of drugs, prostitution, and
some lawful transactions that don’t comply with tax obligations. In these cases,
GDP is not an accurate measure of some components that play a large role in the
economic state of a country.
Income generated in a country by an overseas company that is transferred back to
foreign investors is not taken into account. This overstates a country’s economic
output.
Gross Domestic Product (GDP) is the most common measure to estimate the size of
a country’s economy. It represents the total value of final goods and services produced
domestically, in a given time period. India’s GDP was approximately USD 2.3 trillion
for financial year 2015. What this means is that the total value of final goods
and services produced inside the geographical boundary of India between April 2014
and March 2015 was USD 2.3 trillion.
GDP calculation only includes value of final goods and services, as the value of
intermediary goods & services will automatically be included in the final price.
For example, GDP doesn’t include the value/price of a computer chip, as the same
is included in price of a computer when it is sold. When calculating GDP, all end
goods and services manufactured within the country is considered, regardless of
the country of origin of the manufacturing company. So the value of a Samsung mobile
manufactured in India will be included in GDP, even though Samsung is a foreign
company.
GDP growth rate is the percentage change in GDP, compared to the previous financial
year. It is commonly used to see how many additional goods and services were produced,
compared to the previous year. It is also helpful in comparing two different economies.
If GDP growth rate of India is 7.5% and that of China is 7.0%, it means that Indian
economy is expanding faster than China’s. However, this does not tell us anything
about the overall size of the economy – which is measured by the absolute GDP number.
Let us consider a small example to understand this.
Suppose, last year, India’s GDP was USD 1000 and GDP of china was USD 10,000. This
year, GDP growth rate of India is 9% and that of China is 6%. This means, the value
of additional goods and services produced by India is USD 90 (9%*1,000) and that
in China is USD 600 (6%*10,000). Thus, we can say that India is expanding rapidly,
but the absolute value of additional goods and services, produced by India, is still
less than China’s because of China’s higher base (previous year’s GDP).
GDP per capita is defined as the total GDP divided by the total population. A higher
GDP per capita signifies a higher living standard, as more number of goods and services
are available for each individual within the country.
Inflation
There are different types of inflations like:
- Creeping Inflation
- Galloping Inflation
- Hyperinflation
- Stagflation and
- Deflation.
Inflation measures how much more expensive a set of goods and services has become
over a certain period, usually a year
Inflation is an economic concept that refers to increases in the price level of
goods over a set period of time. The rise in the price level signifies that the
currency in a given economy loses purchasing power (i.e., less can be bought with
the same amount of money).
The causes for inflation in the short term and medium term remain a contested issue
among economists all over the world. However, there is a consensus that, in the
long term, inflation is caused by changes in the money supply.
How is Inflation Calculated?
Inflation is most commonly calculated by observing changes in price indices. Generally,
changes in the Consumer Price Index (CPI) are used as a proxy for inflation. Let’s
say that the CPI for a given nation was 210 at the end of 2017 (the base year) and
220 at the end of 2018. Calculating the percent change in those values will provide
us with the inflation over this time period:
Inflation= (220-210/210)* 100 =4.76%
Thus, we can conclude that inflation was approximately 5% in 2018.
If inputs to produce high-demand, inelastic goods (such as oil or medication) increase
in price, suppliers will be compelled to raise their prices to compensate. This
can be due to a number of reasons, such as environmental catastrophes, tariffs,
government sanctions, or scarcity. If widespread enough, the phenomenon can nudge
the CPI higher, resulting in inflation.
The opposite is also true – whereby lower input costs can result in deflation.
How Does Consumer Demand Affect Inflation?
Holding other factors the same, a rise in consumer demand for goods will lead to
an increase in the price of goods (CPI), as shown below:
Consumer demand for goods may increase due to various factors, such as changes in
consumer appetite, long-term scarcity prospects, or an increase in the money supply.
The opposite is also true; a decrease in consumer demand will result in a lower
CPI, and thus deflation.
How Does Money Supply Affect Inflation?
In the long run, money supply affects the purchasing power of a currency as per
supply and demand rules. The diagram below illustrates how an increase in the money
supply in an economy would affect inflation:
The money supply can increase in a variety of ways, namely if governments print
more money or make credit more easily accessible. Lower interest rates may spur
consumer borrowing and lead to an increase in the money supply. In the diagram above,
we can see that an influx of money in an environment where demand remains the same
will result in a devaluation of the currency in question.
The opposite is also true; if governments restrict the money supply and all else
remains constant, the currency will begin to appreciate in value.
Effects of Inflation
1 Decrease in unemployment
When the price of goods increase, so will revenues and, subsequently, profits for
private enterprises. The influx of capital will enable businesses to expand their
operations by hiring more employees.
2 Decrease in the real value of debt
As explained above, inflation is associated with a decrease in interest rates. Low
interest rates will cause the value of debt and related debt instruments to decrease.
This may incentivize consumer spending as consumers may be more inclined to take
on more debt during the period. On the other hand, businesses may struggle to sell
bonds to finance their operations, as bonds would become less attractive investments.
Investing in FDs thinking you will earn 8% returns?
From an individual investor’s perspective, inflation is one of the most important
indicators to understand and track. Inflation indicates an overall increase in the
general price level of goods and services in a country. When we read that last year
inflation was 7%, it doesn’t mean that price of every product like milk, cars, clothes,
etc., increased by 7%. It means compared to the previous year on average prices
of all goods and services increased by 7%.
Each one of us would have definitely experienced the impact of inflation in our
lives. In 90s, our overall college education fees never used to be more than few
thousand rupees, but now it’s always in lakhs and crores. We know that since our
childhood, prices of almost all goods and services have jumped manyfold. Let’s take
a basic example:
Example1 If your current monthly expenses are `30,000/- per month, then after
20 years you will require `80,000/- a month to just maintain the same lifestyle!
Example 2 An education degree for your child which currently costs `20 lakh
could cost over `34 lakh after 11 years!
This example clearly shows how inflation reduces value of money. Over a period of
time, the same amount of money will buy less units of the same good, thereby reducing
the individual’s purchasing power. Hence it is very important to invest one’s money
and grow it.
Over the last decade, average inflation in India was around 8.4%. After-tax average
rate of return on fixed deposits (assuming tax @ 20%) was around 6.2%. Thus, by
investing in FDs you were actually reducing the value of your money by 2.2% every
year, instead of growing it.
Now that we know what inflation is, we need to understand what causes it. Inflation
depends on price, which is determined by demand and supply. So if people have more
money leading to more demand than supply, price increases. This is called demand
pull inflation and is caused by too much money chasing too few goods. On the other
hand, if supply is less compared to demand, again prices increase and cause inflation.
This is called supply push inflation.
Deflation
Deflation is a decrease in the general price level of goods and services. Put another
way, deflation is negative inflation. When it occurs, the value of currency grows
over time. Thus, more goods and services can be purchased for the same amount of
money.
Deflation is widely regarded as an economic “problem” that can intensify a recession
or lead to a deflationary spiral.
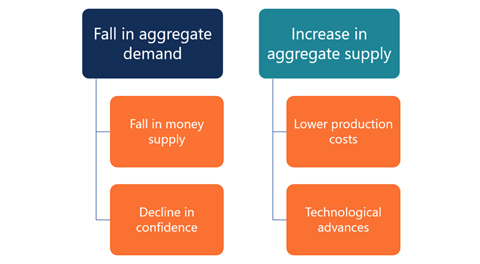
Causes of Deflation
Economists determine the two major causes of deflation in an economy as (1) fall
in aggregate demand and (2) increase in aggregate supply.
The fall in aggregate demand triggers a decline in the prices of goods and services.
Some factors leading to a decline in aggregate demand are:
1Fall in the money supply
A central bank may use a tighter monetary policy by increasing interest rates. Thus,
people, instead of spending their money immediately, prefer to save more of it.
In addition, increasing interest rates lead to higher borrowing costs, which also
discourages spending in the economy.
2Decline in confidence
Negative events in the economy, such as recession, may also cause a fall in aggregate
demand. For example, during a recession, people can become more pessimistic about
the future of the economy. Subsequently, they prefer to increase their savings and
reduce current spending.
An increase in aggregate supply is another trigger for deflation. Subsequently,
producers will face fiercer competition and be forced to lower prices. The growth
in aggregate supply can be caused by the following factors:
1 Lower production costs
A decline in price for key production inputs (e.g., oil) will lower production costs.
Producers will be able to increase production output, which will lead to an oversupply
in the economy. If demand remains unchanged, producers will need to lower their
prices on goods to keep people buying them.
2Technological advances
Advances in technology or rapid application of new technologies in production can
cause an increase in aggregate supply. Technological advances will allow producers
to lower costs. Thus, the prices of products will likely go down.
Effects of Deflation
Frequently, deflation occurs during recessions. It is considered an adverse economic
event and can cause many negative effects on the economy, including:
1 Increase in unemployment
During deflation, the unemployment rate will rise. Since price levels are decreasing,
producers tend to cut their costs by laying off their employees.
Increase in the real value of debt 2
Deflation is associated with an increase in interest rates, which will cause an
increase in the real value of debt. As a result, consumers are likely to defer their
spending.
Deflation spiral
This is a situation where decreasing price levels trigger a chain reaction that
leads to lower production, lower wages, decreased demand, and even lower price levels.
During a recession, the deflation spiral is a significant economic challenge because
it further worsens the economic situation.
Recession
Recession is a term used to signify a slowdown in general economic activity. In
macroeconomics, recessions are officially recognized after two consecutive quarters
of negative GDP growth rates
Causes of a Recession
1 Real factors
A sudden change in external economic conditions and structural shifts can trigger
a recession. This fact is explained by the Real Business Cycle Theory, which says
a recession is how a rational participant in the market responds to unanticipated
or negative shocks.
For example, a sudden rise in oil prices due to growing geopolitical tensions can
harm crude oil-importing economies. A revolutionary technology that causes automation
in factories can disproportionately impact economies with a huge pool of unskilled
labor.
2 Financial/Nominal factors
According to a school of economics called monetarism, a recession is a direct consequence
of over-expansion of credit during expansion periods. It gets exacerbated by insufficient
money supply and credit availability during the initial stages of a slowdown.
There is a significant correlation between monetary and real factors, such as interest
rates and relationships between certain goods. The relationship is not explicit
because monetary policy instruments such as interest rates also encompass institutional
responses to anticipated slowdowns.
3 Psychological factors
Psychological factors include excessive euphoria and overexposure to risky capital
during an economic expansion period. The 2008 Global Financial Crisis was, at least
in part, a result of irresponsible speculation that led to the formation of a bubble
in the housing market in the US. Psychological factors can also manifest as a curtailed
investment resulting from widespread market pessimism, which lacks grounds in the
real economy.
Stagflation
Stagflation is an economic event in which the inflation rate is high, economic growth
rate slows, and unemployment remains steadily high. Such an unfavorable combination
is feared and can be a dilemma for governments since most actions designed to lower
inflation may raise unemployment levels, and policies designed to decrease unemployment
may worsen inflation.
Causes of Stagflation
There is no consensus among economists on the causes of stagflation. Each economics
school offers its own view on its origins. However, two main theories may be derived:
supply shock and poor economic policies.
The supply shock theory suggests that stagflation occurs when an economy faces a
sudden increase or decrease in the supply of a commodity or service (supply shock),
such as a rapid increase in the price of oil. In such a situation, prices surge,
making production costlier and less profitable, thus slowing economic growth.
A second theory states that stagflation can be a result of a poorly made economic
policy. For example, the government can create a policy that harms industries while
growing the money supply too quickly. The simultaneous occurrence of these policies
can lead to slower economic growth and higher inflation.
Example of Stagflation
Stagflation is costly and difficult to eliminate, both in social and fiscal terms.
There could be many reasons, but the concept of “supply shock” allows us to understand
the causes of stagflation the best. Suppose tomorrow all oil producing nations decide
to cut supply and suddenly there is shortage of oil everywhere. Obviously the price
of oil will start increasing. Oil is the lifeblood of any economy as it is used
in various activities like transportation, power generation, manufacturing of goods
etc. Thus rising oil price will push up prices of all goods. Consider oranges, to
get farm produced oranges to a far off market, there is a huge transportation cost
involved which will increase with rising oil prices.
Stagflation is a situation where economy is stagnating, i.e. it is not experiencing
any GDP growth and at the same time there is also high inflation. It is a nightmare
situation for any country, as high prices kill purchasing power and harm the poor,
while low or negative GDP growth worsens the situation by causing unemployment.
Unemployment
The Curse of Joblessness
The number of people at work is generally closely related to whether an economy
is growing at a reasonable rate
Unemployment is a term referring to individuals who are employable and actively
seeking a job but are unable to find a job. Included in this group are those people
in the workforce who are working but do not have an appropriate job. Usually measured
by the unemployment rate, which is dividing the number of unemployed people by the
total number of people in the workforce, unemployment serves as one of the indicators
of a country’s economic status.
Back in the depths the global financial crisis in 2009, the International Labour
Office announced that global unemployment had reached the highest level on record.
t was not a coincidence that the global economy experienced the most severe case
of unemployment during the worst economic crisis since the Great Depression. Unemployment
is highly dependent on economic activity; in fact, growth and unemployment can be
thought of as two sides of the same coin: when economic activity is high, more production
happens overall, and more people are needed to produce the higher amount of goods
and services. And when economic activity is low, firms cut jobs and unemployment
rises. In that sense, unemployment is countercyclical, meaning that it rises when
economic growth is low and vice versa.
But unemployment does not fall in lockstep with an increase in growth. It is more
common for businesses to first try to recover from a downturn by having the same
number of employees do more work or turn out more products—that is, to increase
their productivity. Only as the recovery takes hold would businesses add workers.
As a consequence, unemployment may start to come down only well after an economic
recovery begins. In fact, in the last three recessions, the unemployment rate continued
to rise after the end of the recessions; a phenomenon called “jobless recoveries.”
The phenomenon works in reverse at the start of a downturn, when firms would rather
reduce work hours, or impose some pay cuts before they let workers go. Unemployment
starts rising only if the downturn is prolonged. Because unemployment follows growth
with a delay, it is called a lagging indicator of economic activity.
How sensitive is the unemployment rate to economic growth? That depends on several
factors, most notably labor market conditions and regulations.
Generally high unemployment rate signals recession and problems with the economy.
Thus it is very important to observe and track unemployment levels in an economy
to determine its health.
Business Cycle
A business cycle is a cycle of fluctuations in the Gross Domestic Product (GDP)
around its long-term natural growth rate. It explains the expansion and contraction
in economic activity that an economy experiences over time.
A business cycle is completed when it goes through a single boom and a single contraction
in sequence. The time period to complete this sequence is called the length of the
business cycle. A boom is characterized by a period of rapid economic growth whereas
a period of relatively stagnated economic growth is a recession. These are measured
in terms of the growth of the real GDP, which is inflation-adjusted.
Stages of the Business Cycle
In the diagram above, the straight line in the middle is the steady growth line.
The business cycle moves about the line. Below is a more detailed description of
each stage in the business cycle:
1 Expansion
The first stage in the business cycle is expansion. In this stage, there is an increase
in positive economic indicators such as employment, income, output, wages, profits,
demand, and supply of goods and services. Debtors are generally paying their debts
on time, the velocity of the money supply is high, and investment is high. This
process continues as long as economic conditions are favorable for expansion.
2 Peak
The economy then reaches a saturation point, or peak, which is the second stage
of the business cycle. The maximum limit of growth is attained. The economic indicators
do not grow further and are at their highest. Prices are at their peak. This stage
marks the reversal point in the trend of economic growth. Consumers tend to restructure
their budgets at this point.
3 Recession
The recession is the stage that follows the peak phase. The demand for goods and
services starts declining rapidly and steadily in this phase. Producers do not notice
the decrease in demand instantly and go on producing, which creates a situation
of excess supply in the market. Prices tend to fall. All positive economic indicators
such as income, output, wages, etc., consequently start to fall.
4 Depression
There is a commensurate rise in unemployment. The growth in the economy continues
to decline, and as this falls below the steady growth line, the stage is called
a depression.
5 Trough
In the depression stage, the economy’s growth rate becomes negative. There is further
decline until the prices of factors, as well as the demand and supply of goods and
services, contract to reach their lowest point. The economy eventually reaches the
trough. It is the negative saturation point for an economy. There is extensive depletion
of national income and expenditure.
5 Recovery
After the trough, the economy moves to the stage of recovery. In this phase, there
is a turnaround in the economy, and it begins to recover from the negative growth
rate. Demand starts to pick up due to low prices and, consequently, supply begins
to increase. The population develops a positive attitude towards investment and
employment and production starts increasing.
Employment begins to rise and, due to accumulated cash balances with the bankers,
lending also shows positive signals. In this phase, depreciated capital is replaced,
leading to new investments in the production process. Recovery continues until the
economy returns to steady growth levels.
This completes one full business cycle of boom and contraction. The extreme points
are the peak and the trough.
Indexation
The profit that you make on selling a long-term capital asset is called a long-term
capital gain. But as you know, inflation erodes the value of money. For instance,
the value of Rs 100 was worth more 10 yrs ago than what it is today. That is why
when computing the gains on selling a capital asset, it is important to adjust the
purchase price to account for inflation.
This is done by way of indexation, a method used to reduce tax liability on selling
a capital gain. Indexation accounts for inflation from the year of purchase of an
asset to the year of sale.
How does indexation work?
It inflates the purchase price of an asset by accounting for inflation until the
year of the sale
It reduces the capital gains you earn on selling an asset
Finally, it brings down your tax on capital gains
Before looking at an example, let us understand what are capital assets and capital
gains.
- Capital asset: This is an asset that you hold for over a year with an intention
to not to resell but derive benefits from it for a longer period of time. These
can be financial securities, real estate, and so on in the form of short- or long-term
assets. But for the purpose of indexation, we shall focus on long-term capital assets—held
for 12 to 36 months depending on the asset class.
- Capital gain The profit you earn on selling a capital asset after you have
held it for a minimum holding period is called a capital gain. So when you sell
a residential property after holding it for at least 3 yrs, the profit you make
thereon is a long-term capital gain. Simply put, a capital gain is a difference
between the sale price and the purchase price of a capital asset. As with any other
taxable income, long-term capital gain also attracts income tax.
For instance, if you had bought a residential property for Rs 10 lakh in Mar 2003
and sold it for Rs 35 lakh in Mar 2020, then you have earned a capital gain of Rs
25 lakh. Here, the property is a long-term capital asset and the profit is long-term
capital gain, which attracts income tax. Assuming the rate of tax on long-term capital
gains is 10%, your tax liability on the sale of the property would be Rs 2,50,000!
But thanks to indexation, you don’t have to pay tax on Rs 25 lakh. Here’s why.
As mentioned, indexation inflates the purchase price of an asset. Keeping the sale
price of the asset constant, a lower purchase price increases your capital gain
and tax liability. On the contrary, a higher purchase price decreases long-term
capital gain and tax thereon. For this purpose, you ascertain the indexed cost of
acquisition. Meaning adjusting Rs 10 lakh for inflation over 17 yrs of holding period
so it reflects today’s value.
The rate of inflation considered here is derived from the government’s Cost Inflation
Index (CII), available on the income tax department’s website. Once you have the
CII data, you can calculate the indexed cost of acquisition of the asset or its
inflation-adjusted value as follows:
Indexed cost of acquisition = Original cost of acquisition x (CII of the year of
the sale/CII of year of purchase)
In our example, the indexed cost of acquisition of the residential property = Rs
10 lakh x (280/105) = Rs 26,66,667
Effectively, the capital gains will now be Rs 8,33,333 (Rs 35,00,000 minus Rs 26,66,667)
as against Rs 25 lakh before indexation. Naturally, your tax on capital gain also
reduces to Rs 83,333 as against Rs 2,50,000 before indexation.
By now you may have understood the benefit of indexation. It helps reduce your long-term
capital gains and, in turn, brings down your overall taxable liability.
Interest Rates
Real Interest Rate,It's all relative
Interest rate is one of the most common economic terms that we use in daily life.
Simply put, interest rate is the return earned on money lent out. So if you lend
Rs 100 to your friend and ask her to give back Rs 110 after one year, interest rate
charged by you is 10%. Similarly, if you put Rs 100 in your bank account, the bank
will pay interest as in this case it’s the bank who is taking money from you. If
the bank offers an interest rate of 4%, then after one year you will get Rs 104
from the bank and will earn Rs 4 as interest.
This interest rate that we just discussed and the ones that we generally hear &
read about is called the nominal interest rate. Now let’s see why nominal interest
rate is not very relevant. The basic motive behind investing money is to earn returns/interest
that allows us to retain purchasing power as well as to grow the savings kitty.
This should allow us to improve our standard of living over a period of time. Let
us consider an example. Suppose, you have Rs 1,00,000 and want to buy a high-end
motor bike costing Rs 1,08,000. You decide to invest your money in a fixed deposit
at 9% interest rate. You thought that you will have Rs 1,09,000 at the end of the
year and will easily buy your favourite bike.
But after one year, you realize that the price of the bike has gone up to Rs 1,15,000
(increased by approx 6.5%). You are sad, as again you cannot buy the bike. What
really happened here? Due to general inflation of around 6.5% in the economy, price
of the bike increased proportionately during the course of the year. So in order
to achieve your target of buying the bike you should have invested in an instrument
that returned 15% after a year. That would have allowed you to beat inflation of
6.5% and in addition earn real returns of 8.5%.
Real Interest Rate = Nominal Interest Rate – Inflation Rate
In our example nominal interest rate is 9% and inflation is 6.5% and hence real
interest rate is 2.5% (9%- 6.5%). When we invest our money, some part of what we
are earning is always being eaten away by inflation.
Investors will be able to retain their purchasing power only when they earn returns
equal to or more than the inflation rate. Suppose the inflation rate is 9% and interest
rate is 8%, in real sense you will actually lose 1% of your money, rather than gain
anything. So rather than being able to buy more things after a year, you won’t even
be able to buy the same basket of goods bought earlier, as their market price will
be higher than your investment kitty.
Compared to savings bank accounts, fixed deposits, bonds and other instruments,
only equities as an asset class have generated positive real rate of return in the
last decade. To make money in real sense over the long term, invest in equities.
Currency Appreciation & Depreciation
Not too much, not too little.. just right
Let’s continue our discussion on currency market and movements that we started in
our previous article. We just understood what a currency market is and why currency
appreciates and/or depreciates. In this article let’s try to understand why this
upward/downward movement of currency is so important.
Suppose you want to import a costly laser machine from USA. The cost of machine
is USD 1000. Currently the conversion rate given to you by your dealer is USD 1
= INR 65. So as of today, you will have to spend INR 65,000 to buy this machine.
Due to some issues, you postpone your purchase and decide to buy it next month.
Meanwhile due to reasons beyond your control, USD appreciates. We know that USD
appreciation means INR depreciation. Thus, we will have to pay more in order to
buy each unit of Dollar. Now after one month, you again ask for a quote from your
dealer and he quotes USD 1 = INR 70. Thus, you will now have to pay more to import
the same machine because of USD appreciation (INR depreciation).
Let’s take another example. Suppose you manufacture cycles. You want to export one
cycle to US for INR 6000. The person importing this cycle in US will have to pay
in INR and thus asks for a quote from his dealer to buy INR. His dealer quotes 1USD
= 60 INR. So to buy INR 6000, he will have to spend USD 100 (6000/60). Just as in
previous example, he also faces some issues and postpones his purchase by one month.
After one month, you are again willing to sell the cycle at INR 6000, but suppose
USD appreciated. Now it becomes USD 1 = INR 65. Thus, the US buyer will only have
to pay USD 92.5, in order to buy the same product.
Above examples make it very clear that when foreign currency appreciates (domestic
currency depreciates), local goods become cheaper in other countries, as foreigners
will have to pay less to buy the same amount of INR. At the same time, it makes
foreign goods costly as you will have to pay more to buy each unit of foreign currency.
So when local currency depreciates, imports become costly and price of exported
goods becomes cheap for foreign nationals. As price of imported goods increases,
demand for imported article decreases and as price of goods exported becomes cheaper
for foreigners, foreign demand for local goods increases. Hence we can now conclude
that domestic currency depreciation leads to higher exports and lower imports. Opposite
will happen when domestic currency appreciates.
India is a major oil importer as it doesn’t produce sufficient crude oil to meet
its energy demands. Thus when rupee depreciates, it becomes more expensive for the
Government to import oil. Higher oil prices increases the overall price level, as
explained in our article on stagflation. Thus, it becomes important for many countries
to ensure that their currency doesn’t excessively depreciate. But if a country doesn’t
import many things, then it would want local currency to depreciate, so that local
goods become cheaper in other countries and exports increases. Countries with excessive
focus on exports use currency depreciation technique to boost their exports.
Value of Currency
Why currencies rise and fall
Foreign exchange market (FX, currency market) can be thought of as a global network
of banks and financial institutions, selling and buying currencies from each other;
an Indian bank buying Dollars by paying in Rupees, a European bank buying Rupees
by paying in Dollars etc. Suppose you are planning a trip to Australia and need
Aussie Dollars for being able to buy goods and services in Australia. You can go
to your local bank like HDFC/ICICI or a currency dealer and can buy Aussie Dollar
by paying in Rupees. Instead of an individual, suppose there is an Indian automobile
manufacturer who wants to import auto parts manufactured in Japan. The company will
have to pay in Japanese Yen to buy these auto parts. So it will buy Yen from a bank
or a dealer by paying in Rupee and then pay Yen to the company from which it is
buying these parts. Just like you and this company, there are hundreds of thousands
of individuals and companies around the world seeking foreign currency for various
reasons. They go to their banks and dealers for their needs and these banks and
dealers deal with each other to fulfill the needs of such individuals and companies.
Hence currency market can be described as an interconnected network of these institutions.
Every day in the newspapers, we keep reading that currency is falling or that the
government is doing nothing about currency deprecation etc. The natural question
is why is these so important that it needs so much of our attention and why does
currency actually fall or rise? First, let’s discuss the second part of our question.
Just like other goods and services, price of a currency is also determined by its
demand and supply. Suppose today price of USD 1 is Rs 62. Now assume, lot of Indians
suddenly start travelling to USA or many Indian companies start buying products
from the USA or many Indians start investing in the US in the hope of better opportunities,
all these activities will lead to greater demand for US Dollars from India. We have
already learnt that as demand for a product/service increases, price of the same
also increases. So now USD 1 becomes RS 65 ie we need to pay more, in order to buy
USD 1. In this example, USD appreciated with respect to Rupee by 4.84% [(65-62)/62].
In an opposite case when demand for USD decreases, its price will decrease and we
will have to pay less. Suppose USD 1 becomes equal to RS 60. In this case, USD depreciated
with respect to Rupee by 3.23% [(62-60)/62]. It is important to understand that
if demand for USD is increasing from India, it doesn’t mean that it’s increasing
from rest of the world as well. So USD might not appreciate against other currencies,
as its demand is increasing only against Rupee.
So when a currency appreciates, it means we need to pay more in order to buy 1 unit
of the currency. Similarly if currency depreciates, we need to pay less in order
to buy 1 unit. As you might have already noticed, price of one currency is given
in another currency. In our example, price of USD was given in Rupee. So when one
currency in the pair appreciates, another is depreciating simultaneously and vice
versa. Let’s say initially USD 1 = INR 60 or 1 INR = 1/60 USD. Now USD depreciates.
This means we will have to pay less to buy 1 USD. Suppose it becomes 1USD = 58 INR.
So INR 1 becomes USD 1/58. Initially we had to pay USD 1/60 to buy INR 1, but now
we will have to pay USD 1/58, which is more. Thus, Rupee appreciated when USD depreciated.
Hence, we say that for a currency pair, if one currency is appreciating, the other
depreciates and vice versa.
Monetary Policy
Monetary policy is an economic policy that manages the size and growth rate of the
money supply in an economy. It is a powerful tool to regulate macroeconomic variables
such as inflation and unemployment.
Monetary policy is the process by which the monetary authority of a country, generally
the central bank, controls the supply of money in the economy by its control over
interest rates in order to maintain price stability and achieve high economic growth.
In India, the central monetary authority is the Reserve Bank of India (RBI).
It is designed to maintain the price stability in the economy. Other objectives
of the monetary policy of India, as stated by RBI, are:
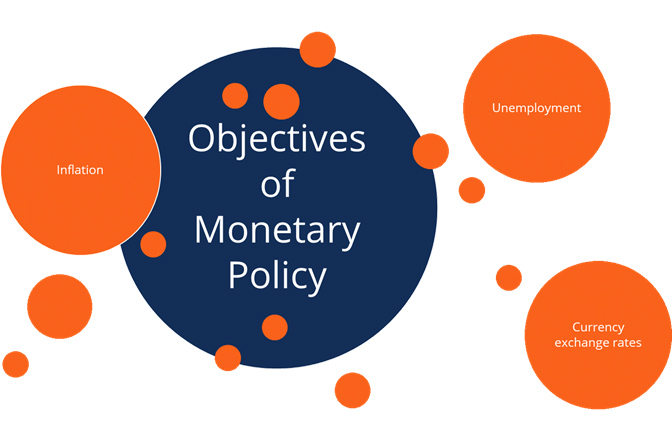
1 Price stability
Price stability implies promoting economic development with considerable emphasis
on price stability. The centre of focus is to facilitate the environment which is
favorable to the architecture that enables the developmental projects to run swiftly
while also maintaining reasonable price stability.
2Controlled expansion of bank credit
One of the important functions of RBI is the controlled expansion of bank credit
and money supply with special attention to seasonal requirement for credit without
affecting the output.
3Promotion of fixed investment
The aim here is to increase the productivity of investment by restraining non essential
fixed investment.
4Restriction of inventories and stocks
Overfilling of stocks and products becoming outdated due to excess of stock often
results in sickness of the unit. To avoid this problem, the central monetary authority
carries out this essential function of restricting the inventories. The main objective
of this policy is to avoid over-stocking and idle money in the organisation.
5Promoting efficiency
It tries to increase the efficiency in the financial system and tries to incorporate
structural changes such as deregulating interest rates, easing operational constraints
in the credit delivery system, introducing new money market instruments, etc.
6Reducing rigidity
RBI tries to bring about flexibilities in operations which provide a considerable
autonomy. It encourages more competitive environment and diversification. It maintains
its control over financial system whenever and wherever necessary to maintain the
discipline and prudence in operations of the financial system.
Monetary policy committee
The Reserve Bank of India Act, 1934 (RBI Act) was amended by the Finance Act, 2016,
to provide a statutory and institutionalised framework for a Monetary Policy Committee,
for maintaining price stability, while keeping in mind the objective of growth.
The Monetary Policy Committee is entrusted with the task of fixing the benchmark
policy rate (repo rate) required to maintain inflation within the specified target
level. As per the provisions of the RBI Act, three of the six Members of the Monetary
Policy Committee will be from the RBI and the other three Members will be appointed
by the Central Government.
The Government of India, in consultation with RBI, notified the 'Inflation Target'
in the Gazette of India Extraordinary dated 5 August 2016 for the period beginning
from the date of publication of the notification and ending on the March 31, 2021
as 4%. At the same time, lower and upper tolerance levels were notified to be 2%
and 6% respectively. Inflation rate in 2020 is 6.2% .
Monetary operations
Monetary operations involve monetary techniques which operate on monetary magnitudes
such as money supply, interest rates and availability of credit aimed to maintain
price stability, stable exchange rate, healthy balance of payment, financial stability,
and economic growth. RBI, the apex institute of India which monitors and regulates
the monetary policy of the country, stabilize the price by controlling inflation.
Instruments of monetary policy
These instruments are used to control the money flow in the economy:
1 Open market operations
An open market operation is an instrument of monetary policy which involves buying
or selling of government securities like government bonds from or to the public
and banks. This mechanism influences the reserve position of the banks, yield on
government securities and cost of bank credit. The RBI sells government securities
to control the flow of credit and buys government securities to increase credit
flow. Open market operation makes bank rate policy effective and maintains stability
in government securities market.
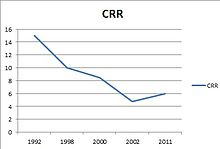 CRR graph from 1992 to 2011[3]
2Cash reserve ratio (CRR)
Cash reserve ratio is a certain percentage of bank deposits which banks are required
to keep with RBI in the form of reserves or balances. The higher the CRR with the
RBI, the lower will be the liquidity in the system, and vice versa. RBI is empowered
to vary CRR between 15 percent and 3 percent. Per the suggestion by the Narasimham
Committee report, the CRR was reduced from 15% in 1990 to 5 percent in 2002. As
of 21st may 2022, the CRR is 4.50 percent
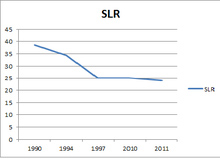 SLR graph from 1991 to 2011
3Statutory liquidity ratio (SLR)
Every financial institution has to maintain a certain quantity of liquid assets
with themselves at any point of time of their total time and demand liabilities.
These assets have to be kept in non cash form such as G-secs precious metals, approved
securities like bonds. The ratio of the liquid assets to time and demand liabilities
is termed as the Statutory liquidity ratio. There was a reduction of SLR from 38.5%
to 25% because of the suggestion by Narsimham Committee. As on 9th October 2020,
the SLR stands at 18%
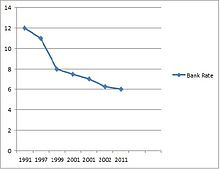 Bank rate graph from 1991 to 2011
4Bank rate policy
The bank rate, also known as the discount rate, is the rate of interest charged
by the RBI for providing funds or loans to the banking system. This banking system
involves commercial and co-operative banks, Industrial Development Bank of India,
IFC, EXIM Bank, and other approved financial institutions. Funds are provided either
through lending directly or discounting or buying money market instruments like
commercial bills and treasury bills. Increase in bank rate increases the cost of
borrowing by commercial banks which results in the reduction in credit volume to
the banks and hence the supply of money declines. Increase in the bank rate is the
symbol of tightening of RBI monetary policy. As of 9th October 2020, the bank rate
is 4.25 percent.
5Credit ceiling
In this operation, RBI issues prior information or direction that loans to the commercial
banks will be given up to a certain limit. In this case, commercial bank will be
tight in advancing loans to the public. They will allocate loans to limited sectors.
A few examples of credit ceiling are agriculture sector advances and priority sector
lending.
6Credit authorisation scheme
Credit authorisation scheme was introduced in November, 1965 when P C Bhattacharya
was the chairman of RBI. Under this instrument of credit regulation, RBI, as per
the guideline, authorise the banks to advance loans to desired sectors.
7Moral suasion
Moral suasion is just as a request by the RBI to the commercial banks to take certain
actions and measures in certain trends of the economy. RBI may request commercial
banks not to give loans for unproductive purposes which do not add to economic growth
but increase inflation.
8Repo rate and reverse repo rate
Repo rate is the rate at which RBI lends to its clients generally against government
securities. Reduction in repo rate helps the commercial banks to get money at a
cheaper rate and increase in repo rate discourages the commercial banks to get money
as the rate increases and becomes expensive. The reverse repo rate is the rate at
which RBI borrows money from the commercial banks. The increase in the repo rate
will increase the cost of borrowing and lending of the banks which will discourage
the public to borrow money and will encourage them to deposit. As the rates are
high the availability of credit and demand decreases resulting to decrease in inflation.
This increase in repo rate and reverse repo rate is a symbol of tightening of the
policy. As of May 2022, the repo rate is 4.40% and the reverse repo rate is 3.35%
Latest RBI Bank Rates in Indian Banking - 2022
| SLR Rate
|
CRR
|
MSF
|
Repo Rate
|
Reverse Repo Rate
|
Base Rate
|
| 18%
|
3%
|
4.25%
|
4%
|
3.35%
|
8.15% - 9.40%
|
RBI Repo Rate Trend Chart
Repo rate also known as the benchmark interest rate is the rate at which the RBI
lends money to the banks for a short term. When the repo rate increases, borrowing
from RBI becomes more expensive. If RBI wants to make it more expensive for the
banks to borrow money, it increases the repo rate similarly, if it wants to make
it cheaper for banks to borrow money it reduces the repo rate. Current repo rate
is 4%
Reverse Repo rate is the short term borrowing rate at which RBI borrows money from
banks. The Reserve bank uses this tool when it feels there is too much money floating
in the banking system. An increase in the reverse repo rate means that the banks
will get a higher rate of interest from RBI. As a result, banks prefer to lend their
money to RBI which is always safe instead of lending it others (people, companies
etc) which is always risky.
Repo Rate signifies the rate at which liquidity is injected in the banking system
by RBI, whereas Reverse Repo rate signifies the rate at which the central bank absorbs
liquidity from the banks.
RBI joined other central banks and slashed the repo rate, reverse repo rate and
CRR to help maintain stability as a response to the Corona Virus crisis. In April
2020, RBI cut the reverse repo rate so banks will get lower interest rate which
will push them to give out more loans to the general public and companies. In May
2020, they slashed repo and reverse repo rate again. RBI also extended the moratorium
on payment of loans by another three months till August.
Fiscal Policy
Fiscal policy refers to the budgetary policy of the government, which involves the
government controlling its level of spending and tax rates within the economy. The
government uses these two tools to influence the economy. It is the sister strategy
to monetary policy. Although both fiscal policy and monetary policy are related
to government revenues and expenditures and both seek to correct situations of excess
or deficient demand in the economy, they do so in very different ways.
Origins of Fiscal Policy
Before the Great Depression, governments across the world followed the policy of
Laissez-faire (or Let it be). This approach to the economy was based on the teachings
of classical economists such as Adam Smith and Alfred Marshall. Classical economists
believed in the power of the invisible hand of the market. They were of the opinion
that the government should not interfere in the economy, as any interference in
the market was uncalled for.
However, the 1929 stock market crash that ushered in the Great Depression fundamentally
changed the course of economic thought. The Depression resulted in low economic
demand along with high unemployment. Classical economics could not provide any solution
to the crisis.
In 1936, British economist John Maynard Keynes published “The General Theory of
Employment, Interest, and Money” (known simply as “The General Theory”). In it,
Keynes called for an increase in government spending to combat the recessionary
forces in the economy. He believed that an increase in government spending would
bring about an increase in demand for commodities in the market.
Since Central bank is an autonomous body it is not under any obligation to follow
Government orders/directives. In such a scenario, how do Governments increase/decrease
money supply in the economy, independent of Central bank’s actions? Read on to know
more.
From our article on measuring GDP, we know that both consumption by households and
Government expenditure on public goods are used in calculating GDP. As consumption
and/or Government expenditure increases, GDP also increases. In order to know more
about how government increases/decreases money supply, first we need to understand
consumption and government expenditure in detail. Consumption is contingent on income
and higher the income, higher will be the consumption
How Does Fiscal Policy Work?
Proponents of Fiscal Policy utilization believe that public finance can influence
inflation and employment by manipulating two key variables:
- The level of government spending or the amount of money the government spends
- The tax rate or the amount of money the government earns
Government expenditure includes building schools, roads, bridges, ports etc. It
also includes expenditure on social welfare schemes as well as salaries paid to
various government employees. Whenever Government increases its expenditure, it
results in creation of more public goods or higher allocation to welfare schemes
like education or healthcare. This leads to increased income for labourers building
the road, teachers in the school or hospital workers. So we can conclude that increased
Government expenditure puts more money into the hands of the people or increases
their income, leading to higher GDP.
When government increases expenditure and reduces tax rate, it acts as a double
booster and transfers more money to individuals. This results in increased consumption
and higher GDP. Such policies are called expansionary fiscal policy. On the other
hand, increasing tax rate and reducing Government expenditure, takes away money
from individuals, lowering consumption and GDP. Such policies are called contractionary
fiscal policy.
This can also be understood through Government’s deficit. Tax represents Government’s
income and and it’s spending is the amount invested in creating public goods and
implementing welfare schemes. . If the Government is spending more than what it
earns, it will have a deficit. If the deficit is expanding, it could be because
of increasing expenditure, decreasing tax or both. In such cases, Government is
following an expansionary fiscal policy. Similarly, if Government deficit is decreasing,
it is following a contractionary fiscal policy.
Difference between Monetary Policy and Fiscal Policy
Monetary policy and fiscal policy are two different tools that have an impact on
the economic activity of a country.
Monetary policies are formed and managed by the central banks of a country and such
a policy is concerned with the management of money supply and interest rates in
an economy.
Fiscal policy is related to the way a government is managing the aspects of spending
and taxation. It is the government’s way of stabilising the economy and helping
in the growth of the economy.
Governments can modify the fiscal policy by bringing in measures and changes in
tax rates to control the fiscal deficit of the economy.
Below are certain points of difference between the monetary and fiscal policy
| Monetary Policy
|
Fiscal Policy
|
| Definition
|
| It is a financial tool that is used by the central banks in regulating the flow
of money and the interest rates in an economy
|
It is a financial tool that is used by the central government in managing tax revenues
and policies related to expenditure for the benefit of the economy
|
| Managed By
|
| Central Bank of an economy
|
Ministry of Finance of an economy
|
| Measures
|
| It measures the interest rates applicable for lending money in the economy
|
It measures the capital expenditure and taxes of an economy
|
| Focus Area
|
| Stability of an economy
|
Growth of an economy
|
| Impact on Exchange rates
|
| Exchange rates improve when there is higher interest rates
|
It has no impact on the exchange rates
|
| Targets
|
| Monetary policy targets inflation in an economy
|
Fiscal policy does not have any specific target
|
| Impact
|
| Monetary policy has an impact on the borrowing in an economy
|
Fiscal policy has an impact on the budget deficit
|